Last week we published twelve numbers. Ten were off, a little too high. Projected David Montgomery for 77 yards, he went for 10 rushing yards. We assumed the carries from week 1 would matter, welp they did not. This miss led to finding a bug in the model, which is good news. This means we can fine tune and move forward.
How our Week 1 projections actually did
Want to audit last week, look no further than this table here.
| RB | Team | Proj | Actual | Miss | Wk1 car | Wk2 car | Car change |
|---|---|---|---|---|---|---|---|
| Jahmyr Gibbs | DET | 112 | 52 | -60 | 29 | 16 | -13 |
| Kenneth Walker III | KC | 98 | 117 | +19 | 23 | 24 | +1 |
| Derrick Henry | BAL | 97 | 68 | -29 | 24 | 16 | -8 |
| Ashton Jeanty | LV | 85 | 48 | -37 | 23 | 21 | -2 |
| Bijan Robinson | ATL | 85 | 72 | -13 | 21 | 16 | -5 |
| Breece Hall | NYJ | 84 | 29 | -55 | 22 | 16 | -6 |
| David Montgomery | HOU | 77 | 10 | -67 | 20 | 6 | -14 |
| Jonathan Taylor | IND | 77 | 92 | +15 | 19 | 24 | +5 |
| D’Andre Swift | CHI | 76 | 45 | -31 | 18 | 16 | -2 |
| Cam Skattebo | NYG | 73 | 36 | -37 | 18 | 12 | -6 |
| Jacory Croskey-Merritt | WAS | 66 | 43 | -23 | 16 | 12 | -4 |
| Rhamondre Stevenson | NE | 65 | 43 | -22 | 18 | 6 | -12 |
Typical miss: 34 yards. We said ±26. We over-projected 10 of 12, by an average of 28 yards.
Ten of the twelve running backs had a decrease in carries. Across all twelve, 251 carries in week 1 to 185 carries in week 2. That figures to be a ~26% decrease.
Where the miss came from
| Source of the miss | Yards |
|---|---|
| Carries that did not repeat | -255 |
| Yards per carry being off | -85 |
| Total | -340 |
It appears ~75% was volume which accounts for the miss.
Workload regresses too
The chart below shows a really interesting finding on where a running back’s carries go after a big volume week.
Notice how every section, starting from fewest carries, leads to a bigger fall.
What’s that saying,
the bigger they are the harder they something.
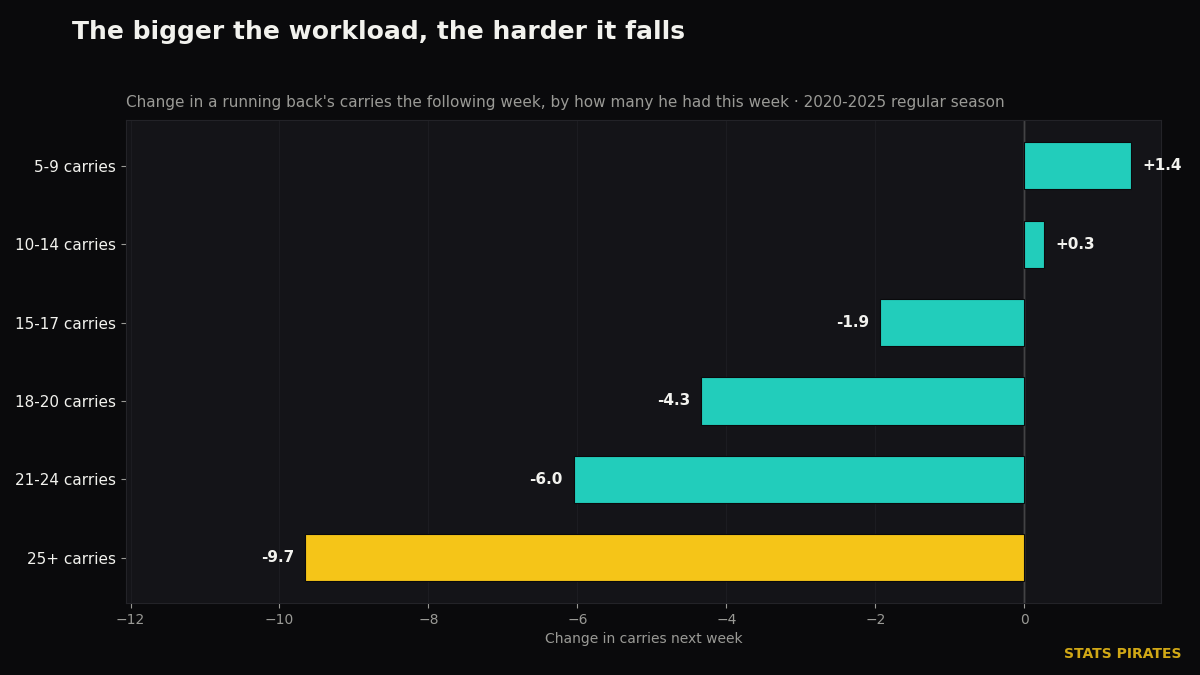
| Carries this week | n | Avg this wk | Avg next wk | Change | % who lose carries |
|---|---|---|---|---|---|
| 5-9 | 1,415 | 7.0 | 8.4 | +1.4 | 42% |
| 10-14 | 1,280 | 11.9 | 12.2 | +0.3 | 49% |
| 15-17 | 572 | 15.9 | 14.0 | -1.9 | 62% |
| 18-20 | 391 | 18.9 | 14.5 | -4.3 | 76% |
| 21-24 | 269 | 22.1 | 16.1 | -6.0 | 83% |
| 25+ | 152 | 27.4 | 17.8 | -9.7 | 91% |
The rule: next week’s carries ≈ 5.5 + 0.50 × this week's, against a
league average of 12.7.
| Carries this week | Expect next week |
|---|---|
| 10 | 10.5 |
| 15 | 13.0 |
| 20 | 15.5 |
| 25 | 18.0 |
| 30 | 20.5 |
Half of any given week’s workload is gone by the next week, and vice-versa.
“It’s just blowouts” … not so fast!
| That week’s game | n | Avg carries | Next week | Change |
|---|---|---|---|---|
| Won by 14+ | 75 | 24.8 | 17.1 | -7.7 |
| Won by 1-13 | 177 | 25.1 | 16.7 | -8.4 |
| Lost | 73 | 24.3 | 17.5 | -6.8 |
You may be thinking, of course there will be a ton of carries in a blowout win, but I caution against thinking this. According to the table above the change is bound to happen in either direction whether a team won or lost. Actually, maybe the thinking is pretty close to correct.
So is workload useless? Not quite, it’s still the best thing we have
Do we ignore workload/carries? No, they are still very stable over the long haul.
| Metric | Correlation, same back, consecutive weeks |
|---|---|
| Carries | +0.357 |
| Rushing yards | +0.237 |
| Yards per carry | +0.048 |
So we fixed it
| Projecting Week 3 yards from | Typical miss | r |
|---|---|---|
| Week 1 carries only | 27.3 | +0.214 |
| Week 2 carries only | 26.7 | +0.274 |
| Weeks 1-2 average | 26.4 | +0.290 |
The model already shrinks running backs over expected, but was not shrinking carries per game yet. Truth it, we did just miss this. Was not on the radar.
| High-workload backs (≥18 car/g) | Bias | Typical miss |
|---|---|---|
| Week 1, before the fix | -17.4 | 32.0 |
| Week 2, before the fix | -21.0 | 33.9 |
| Week 3, before the fix | +3.1 | 30.6 |
| Week 6+, before the fix | +2.7 | 32.5 |
That bling spot can now see, let the light in!
| Model | Typical miss | Weeks 1-2 | Bias on high-workload backs |
|---|---|---|---|
| What we published last week | 26.2 | 25.9 | -18.8 |
| + shrink the workload | 26.4 | 26.5 | -1.8 |
| + last season’s workload | 26.3 | 26.1 | -2.6 |
The Week 3 traps
Be wary of a running back who comes out of nowhere with a huge workload on any given week, they might let you down the next game.
| RB | Team | Wk1 car | Wk2 car | 2-wk avg | What we believe | The read |
|---|---|---|---|---|---|---|
| Emanuel Wilson | SEA | 2 | 21 | 11.5 | 11.5 | the waiver add we are being told to make |
| Aaron Jones | MIN | 12 | 23 | 17.5 | 13.5 | |
| Omarion Hampton | LAC | 12 | 23 | 17.5 | 13.5 | |
| De’Von Achane | MIA | 11 | 20 | 15.5 | 12.9 | |
| Bucky Irving | TB | 8 | 17 | 12.5 | 11.9 | |
| James Cook | BUF | 13 | 21 | 17.0 | 13.4 | led Week 2 in rushing yards |
| TreVeyon Henderson | NE | 0 | 16 | 16.0 | 12.4 | brand-new role, so some inferring |
| Jonathan Taylor | IND | 19 | 24 | 21.5 | 14.9 | two straight — the real workload |
| Kenneth Walker III | KC | 23 | 24 | 23.5 | 15.5 | two straight — the real workload |
Your intuition is correct after all, a workhorse is a workhorse. Stick with them as their carries will remain and be consistent. That speculative one, let them remain speculative.
Week 3 projections
Typical miss on these is ±26 yards.
| RB | Team | Wk 3 opp | Car/g | YOE/g | Opp D | Proj yds | Proj TD | Read |
|---|---|---|---|---|---|---|---|---|
| Kenneth Walker III | KC | MIA | 23.5 | +46.5 | +49 | 83 | 0.56 | under-scored the chances |
| Derrick Henry | BAL | DAL | 20.0 | +23.6 | +48 | 77 | 0.71 | |
| Jahmyr Gibbs | DET | NYJ | 22.5 | +10.9 | +10 | 72 | 0.63 | |
| Jonathan Taylor | IND | HOU | 21.5 | +6.6 | -69 | 71 | 0.76 | TD luck this week |
| James Cook | BUF | LAC | 17.0 | +23.5 | +2 | 68 | 0.53 | hot week → projected off carries |
| Ashton Jeanty | LV | NO | 22.0 | -18.3 | -33 | 68 | 0.53 | cold week → yards should return |
| D’Andre Swift | CHI | PHI | 17.0 | +14.0 | -5 | 64 | 0.61 | cold week → yards should return |
| Breece Hall | NYJ | DET | 19.0 | -18.2 | +4 | 64 | 0.50 | cold week → yards should return |
| Bijan Robinson | ATL | GB | 18.5 | -8.0 | -13 | 60 | 0.44 | |
| Kyren Williams | LA | DEN | 11.5 | +16.4 | -57 | 60 | 0.46 | hot week → projected off carries |
| Chase Brown | CIN | PIT | 18.0 | -8.7 | -8 | 60 | 0.50 | |
| Tony Pollard | TEN | NYG | 10.5 | +4.1 | +112 | 60 | 0.37 | |
| Omarion Hampton | LAC | BUF | 17.5 | -9.7 | +67 | 59 | 0.50 | |
| Christian McCaffrey | SF | ARI | 10.0 | +7.3 | +60 | 58 | 0.55 | |
| Bucky Irving | TB | MIN | 12.5 | +9.9 | -35 | 55 | 0.44 |
Let us see what tomorrow brings