Running Backs. Touchdowns. Let’s focus on that. Carries, yards, and efficiency are reasonably stable from year to year; but rushing touchdowns swing hard on goal-line luck, game script and vultures. All of that is what makes the stat useful for prediction: when a running back’s touchdown count falls well below what his opportunities should have produced, the gap tends to close the following season.
Below are the 2025 running backs most likely to see their touchdown totals climb in 2026.
How we find under-scorers
Every rush in the league is a scoring opportunity, but not an equal one. A carry from the opponent’s three-yard line scores a touchdown far more often than one from midfield. So we build an expected-touchdown (xTD) model straight from the play-by-play:
- League-wide P(TD) by field position. Bucket every rushing attempt by yard line and measure how often carries from each bucket actually score. That gives a self-calibrating “this carry was worth x touchdowns” value.
- Sum it per back. Add up that per-carry value over a running back’s season to get his expected rushing touchdowns.
- Compare to reality.
TD over expected = actual − expected. A large negative number means he left touchdowns on the field given where he ran. A positive-regression candidate. - Corroborate with efficiency. Next Gen Stats’ rush yards over expected per attempt (RYOE/att) tells us whether he was actually running well. A back who under-scored and posted positive RYOE/att is the cleanest bounce-back call: the missing touchdowns are luck, not bad running.
We only rank qualifying backs (at least 100 carries) because touchdown rates over small samples are not as useful
The 2025 under-scorers
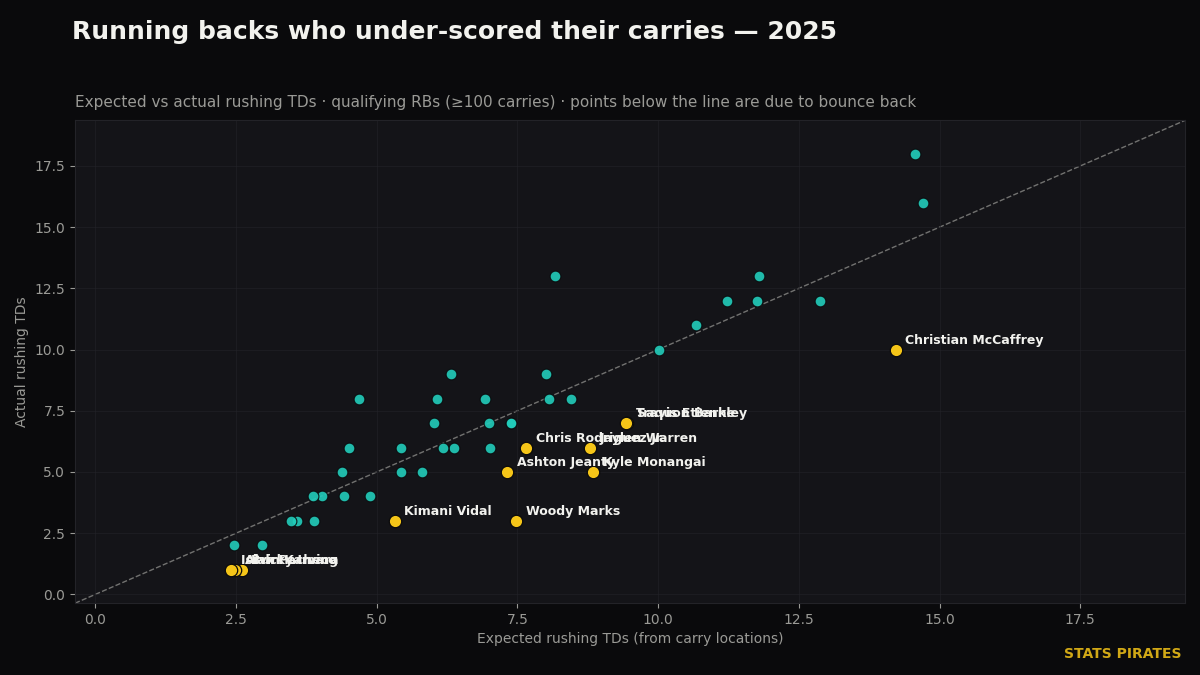
Every dot is a qualifying running back. The dashed line is “scored exactly what you’d expect.” Backs below the line under-scored their opportunities. The gold dots, the furthest below, are our top bounce-back candidates.
| RB | Team | Carries | Rush TD | Expected TD | TD vs Exp | RYOE/att |
|---|---|---|---|---|---|---|
| Woody Marks | HOU | 229 | 3 | 7.5 | −4.5 | +0.07 |
| Christian McCaffrey | SF | 337 | 10 | 14.2 | −4.2 | −0.61 |
| Kyle Monangai | CHI | 192 | 5 | 8.8 | −3.9 | +0.19 |
| Jaylen Warren | PIT | 223 | 6 | 8.8 | −2.8 | +0.83 |
| Saquon Barkley | PHI | 307 | 7 | 9.4 | −2.5 | +0.31 |
| Travis Etienne | JAX | 270 | 7 | 9.4 | −2.4 | +0.19 |
| Kimani Vidal | LAC | 166 | 3 | 5.3 | −2.3 | +0.29 |
| Ashton Jeanty | LV | 267 | 5 | 7.3 | −2.3 | −0.28 |
| Chris Rodriguez Jr. | WAS | 112 | 6 | 7.7 | −1.7 | +0.53 |
| Bucky Irving | TB | 173 | 1 | 2.6 | −1.6 | −0.58 |
| Alvin Kamara | NO | 131 | 1 | 2.5 | −1.5 | −0.78 |
| Isiah Pacheco | KC | 118 | 1 | 2.4 | −1.4 | −0.65 |
What stands out
- Woody Marks is the headline (hear me out). A 229-carry workload produced just three rushing scores against 7.5 expected; a 4.5-touchdown shortfall, the largest of any qualifier. All while he ran right at expectation (+0.07 RYOE/att). Carry volume that heavy rarely stays that cold near the goal line two years running.
- Jaylen Warren is the cleanest signal on the board. He’s down 2.8 touchdowns under expected and posted a group-best +0.83 rush yards over expected per attempt. When a back under-scores while running that efficiently, the touchdown count is THE thing that’s lying; not the running.
- The cautionary name is Christian McCaffrey. The raw gap is enormous (10 scores on 14.2 expected, −4.2 over a 337-carry season), but his −0.61 RYOE/att says he was running below expectation in 2025. The opportunity is real; the efficiency isn’t. Bank on a partial rebound, not a return to peak.
- Furthermore, treat Bucky Irving and Alvin Kamara the same way, since both pair their under-scoring with negative efficiency.
The caveats
Expected touchdowns is an opportunity model, not a projection. It says nothing about a back changing teams, a new goal-line committee, or an offense that gets worse. Two honest limits:
- Role can change. A back who under-scored behind a bad offense only regresses up if the offense, and his share of it, holds.
- Efficiency is the tiebreaker. When the RYOE/att signal disagrees with the touchdown gap, trust it less. The strongest calls are negative TD-over-expected and positive RYOE/att together.
Want to pull the underlying numbers yourself? Ask the query tool for “top rbs by rushing touchdowns in 2025” and slice from there.