We built our own model to project each team’s 2026 win total. It reads three things about a team’s 2025 season: its win-loss record, how well its offense played, and how well its defense played. We fit it on the six most recent completed seasons, 2020 through 2025.
Before the projections, three things the model learned along the way. Those which shape how much weight the rest of this deserves.
What six seasons of data shows
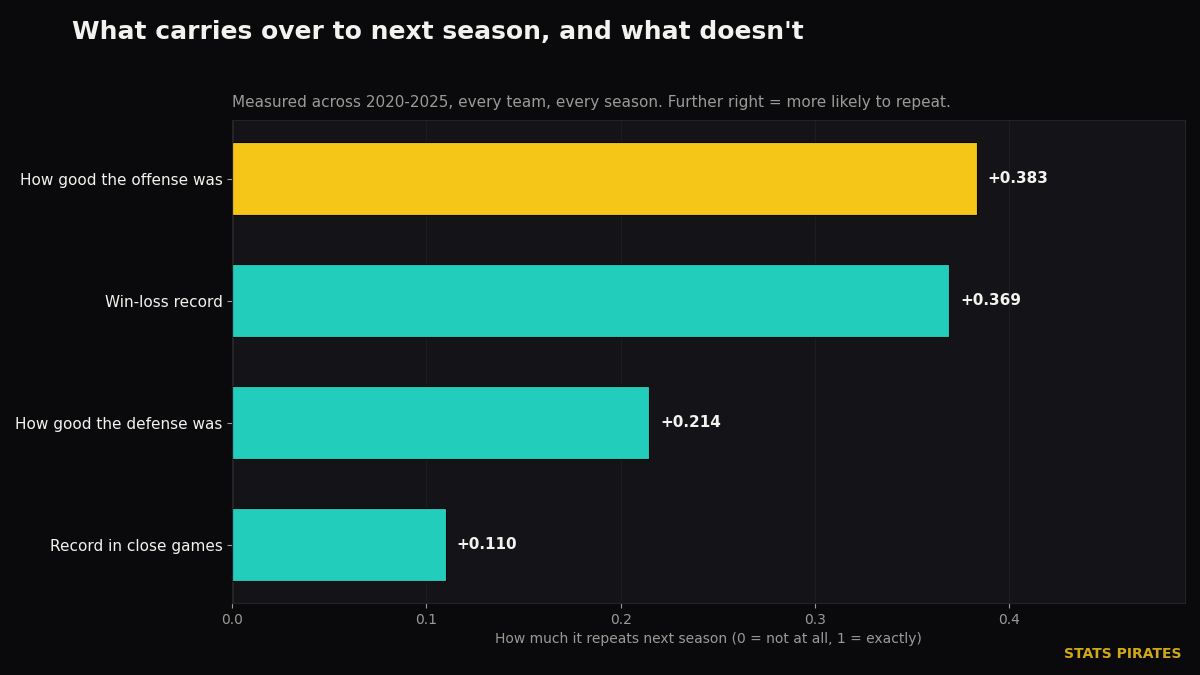
A team’s record in close games does not repeat. How a team does in one-score games tells us almost nothing about how it will do in one-score games the following year (surpsising to me). Denver, as an example, went 11-2 in those games last season. That is not a property of Denver, and we would not project any of it forward.
Records drift back toward the middle. Of the teams in our data that won 12 or more games, 87% won fewer the next season. Of the teams that won five or fewer, 79% won more. This is the single strongest force in the projections, and it is worth mentioning that it is not a particularly sophisticated one.
Offense carries forward better than defense. A good offense tends to still be good the following year. A good defense, turns out, frequently is not. That makes one question genuinely useful when reading a team’s record: was it built on offense, or on defense?
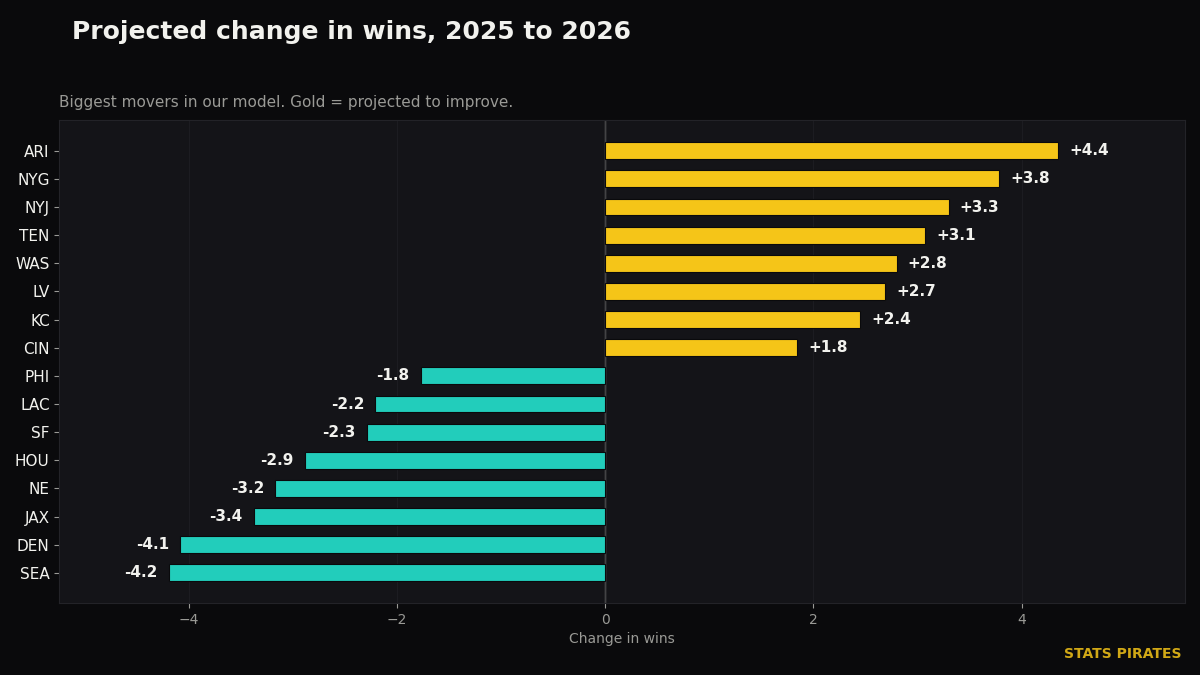
Teams projected to improve
| Team | 2025 | Close games | Offense rank | Defense rank | Proj. 2026 | Change |
|---|---|---|---|---|---|---|
| ARI | 3-14 | 2-8 | 23 | 27 | 7.4 | +4.4 |
| NYG | 4-13 | 1-7 | 17 | 25 | 7.8 | +3.8 |
| NYJ | 3-14 | 3-5 | 29 | 31 | 6.3 | +3.3 |
| TEN | 3-14 | 2-5 | 30 | 28 | 6.1 | +3.1 |
| WAS | 5-12 | 2-5 | 18 | 30 | 7.8 | +2.8 |
| LV | 3-14 | 2-5 | 32 | 20 | 5.7 | +2.7 |
| KC | 6-11 | 1-9 | 11 | 12 | 8.4 | +2.4 |
| CIN | 6-11 | 3-5 | 19 | 29 | 7.8 | +1.8 |
Six of these eight won five games or fewer, and we would rather say plainly than dress up what is driving that: mostly it is the bottom of the standings moving back toward the middle. Arizona is the clearest example. They were bad, and bad teams usually become less bad (I said usually).
The offense column is what separates teams that otherwise look identical. Arizona and the Jets both went 3-14, but the Jets ranked 29th on offense to Arizona’s 23rd, and land more than a win lower as a result. Kansas City is the one team here that was not bad: 6-11 with the 11th-ranked offense and 12th-ranked defense. More on them later.
Teams projected to decline
| Team | 2025 | Close games | Offense rank | Defense rank | Proj. 2026 | Change |
|---|---|---|---|---|---|---|
| SEA | 14-3 | 6-3 | 13 | 2 | 9.8 | -4.2 |
| DEN | 14-3 | 11-2 | 10 | 6 | 9.9 | -4.1 |
| JAX | 13-4 | 6-3 | 14 | 3 | 9.6 | -3.4 |
| NE | 14-3 | 7-3 | 1 | 11 | 10.8 | -3.2 |
| HOU | 12-5 | 7-5 | 21 | 1 | 9.1 | -2.9 |
| SF | 12-5 | 5-1 | 6 | 24 | 9.7 | -2.3 |
| LAC | 11-6 | 6-2 | 25 | 7 | 8.8 | -2.2 |
| PHI | 11-6 | 8-4 | 16 | 8 | 9.2 | -1.8 |
The two rank columns explain most of this list. Five of the top seven had a top-eight defense, and four of those five had an offense ranked 13th or worse. Strong defense, ordinary offense, strong record. Given how little defensive performance repeats, the model treats that combination as the least durable one on the board.
New England is the useful contrast. Same 14-3 as Seattle, but the best offense in football rather than the second-best defense, and it projects roughly a win better than Seattle or Denver in 2026. The record was identical. What produced it was not.
A closer look at Kansas City
Kansas City is the team we spent the most time on, because the surface reading and the underlying one disagree more than for anyone else.
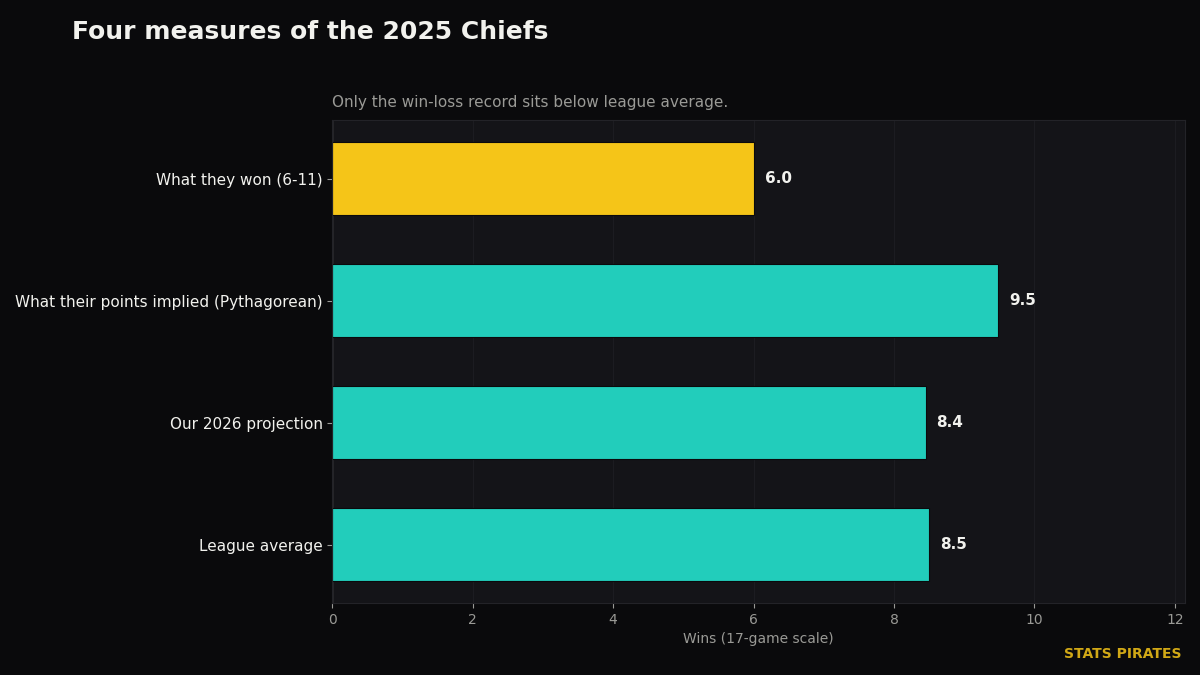
They went 6-11 while outscoring their opponents by 34 points, and went 1-9 in one-score games, the worst close-game record of any team in the six seasons we looked at. By points alone they played like a nine-win team. Their offense finished 11th and their defense 12th. Very little underneath the record looks like a 6-11 roster, and the model projects them up 2.4 wins.
One finding tempers our confidence. Six teams in our data finished a season with a winning point differential and a losing record, the same unusual combination. Five of the six won fewer games the following year, several of them considerably fewer: New England went 8-9 and then 4-13, Arizona 8-9 and then 3-14. Six teams is far too small a sample to draw a rule from, and we are not treating it as one. But it is the closest comparison our data offers, and it argues for holding the Kansas City projection loosely rather than tightly.
Our read: the direction is right and the magnitude is uncertain. A team that plays like a nine-win team and wins six is more likely to improve than not. We would be careful about assuming the improvement is owed.
Every team
Click to see all 32 teams
| Team | 2025 | Close games | Offense rank | Defense rank | Proj. 2026 | Change |
|---|---|---|---|---|---|---|
| ARI | 3-14 | 2-8 | 23 | 27 | 7.4 | +4.4 |
| NYG | 4-13 | 1-7 | 17 | 25 | 7.8 | +3.8 |
| NYJ | 3-14 | 3-5 | 29 | 31 | 6.3 | +3.3 |
| TEN | 3-14 | 2-5 | 30 | 28 | 6.1 | +3.1 |
| WAS | 5-12 | 2-5 | 18 | 30 | 7.8 | +2.8 |
| LV | 3-14 | 2-5 | 32 | 20 | 5.7 | +2.7 |
| KC | 6-11 | 1-9 | 11 | 12 | 8.4 | +2.4 |
| CIN | 6-11 | 3-5 | 19 | 29 | 7.8 | +1.8 |
| DAL | 7.5-9.5 | 4.5-3.5 | 5 | 32 | 9.0 | +1.5 |
| NO | 6-11 | 3-5 | 27 | 10 | 7.4 | +1.4 |
| CLE | 5-12 | 3-6 | 31 | 5 | 6.4 | +1.4 |
| IND | 8-9 | 3-7 | 9 | 16 | 9.1 | +1.1 |
| MIA | 7-10 | 4-3 | 22 | 26 | 8.0 | +1.0 |
| BAL | 8-9 | 2-5 | 12 | 21 | 8.7 | +0.7 |
| DET | 9-8 | 3-5 | 7 | 14 | 9.3 | +0.3 |
| TB | 8-9 | 6-6 | 20 | 17 | 8.3 | +0.3 |
| ATL | 8-9 | 5-5 | 24 | 15 | 8.2 | +0.2 |
| GB | 9.5-7.5 | 4.5-5.5 | 4 | 22 | 9.6 | +0.1 |
| CAR | 8-9 | 7-3 | 26 | 23 | 8.0 | -0.0 |
| PIT | 10-7 | 7-3 | 15 | 18 | 8.9 | -1.1 |
| MIN | 9-8 | 5-4 | 28 | 4 | 7.7 | -1.3 |
| CHI | 11-6 | 7-4 | 8 | 19 | 9.6 | -1.4 |
| LA | 12-5 | 4-5 | 2 | 9 | 10.4 | -1.6 |
| BUF | 12-5 | 5-3 | 3 | 13 | 10.3 | -1.7 |
| PHI | 11-6 | 8-4 | 16 | 8 | 9.2 | -1.8 |
| LAC | 11-6 | 6-2 | 25 | 7 | 8.8 | -2.2 |
| SF | 12-5 | 5-1 | 6 | 24 | 9.7 | -2.3 |
| HOU | 12-5 | 7-5 | 21 | 1 | 9.1 | -2.9 |
| NE | 14-3 | 7-3 | 1 | 11 | 10.8 | -3.2 |
| JAX | 13-4 | 6-3 | 14 | 3 | 9.6 | -3.4 |
| DEN | 14-3 | 11-2 | 10 | 6 | 9.9 | -4.1 |
| SEA | 14-3 | 6-3 | 13 | 2 | 9.8 | -4.2 |
Where this model is weak
Three limits, all of them real:
- The projections miss by about 2.4 wins on average. Not a crystal ball, but a guide. Something to point us in the right direction more than hit the bullseye. “This team is pointed upward” is a fair reading; “this team wins 9.8 games” less so.
- The model knows nothing about the offseason. No trades, no draft, no injuries, no coaching changes and no quarterback changes. A team with a new quarterback has broken its main assumption. To hammer the point, this is a simple model focused on what it currently knows. Improvements to come.
- Six seasons is a thin history. Enough to establish that close-game records do not repeat. Not enough to settle much else. The risk of over-fitting would arise like a necromancer’s puppet if too many seasons were to be considered.
If there is one thing to carry away from this, it is the offense-versus-defense split. A 13-win record built on offense and a 13-win record built on defense are not the same asset going into the following September, and our projections separate the two more than anything else.
Want to check any of this yourself? Ask the query tool for “epa per play by team in 2025”.